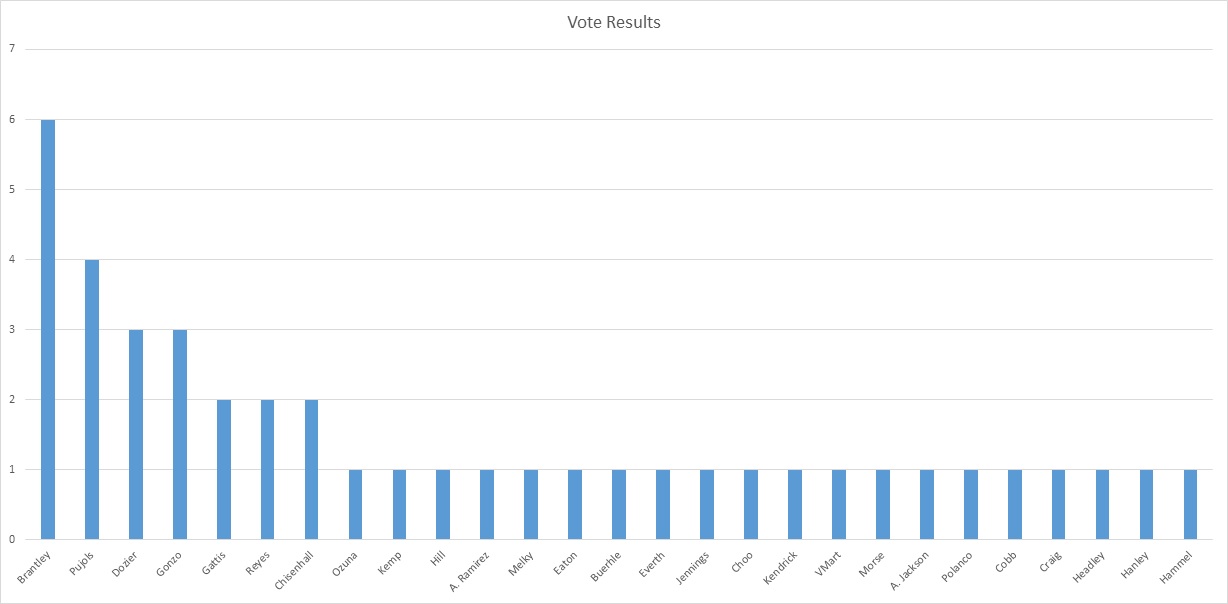
As many of you know, I went in a new direction to get inspiration for what player I will cover. I took a page out of Who Wants to be a Millionaire’s playbook and I asked the audience. That audience only has four choices though…you guys had over four hundred. Here are you results:
There isn’t much need for a drum roll though, unless none of you read the titles of these things. Ah yes, Michael Brantley, how your owners love you so. If you were lucky enough to draft him, probably after 200th overall, you’re getting a great bang for your buck. Brantley is a top ten outfielder right now, and arguably a top five one. On draft day, the tenth outfielder was going around twenty-fifth to thirtieth overall. And the player drafted probably had a name like Giancarlo Stanton, Yasiel Puig, or Jose Bautista. Just for kicks and giggles, let’s compare Brantley’s season to everyone’s favorite outfielder, Mike Trout:
| Player | R | HR | RBI | SB | AVG | OBP |
|---|---|---|---|---|---|---|
| Trout | 49 | 16 | 54 | 9 | .303 | .394 |
| Brantley | 49 | 11 | 46 | 9 | .320 | .386 |
Looks comparable, if you ask me…
Category One: Injury Risk
I always have trouble writing this section of the article. Most players don’t have anything significantly outlandish when it comes to being injury prone. In turn, it can make this section slightly dull. I try to compensate for this by lowering the point value in this category. Unfortunately for us, Brantley is pretty run of the mill when it comes to injury risks.
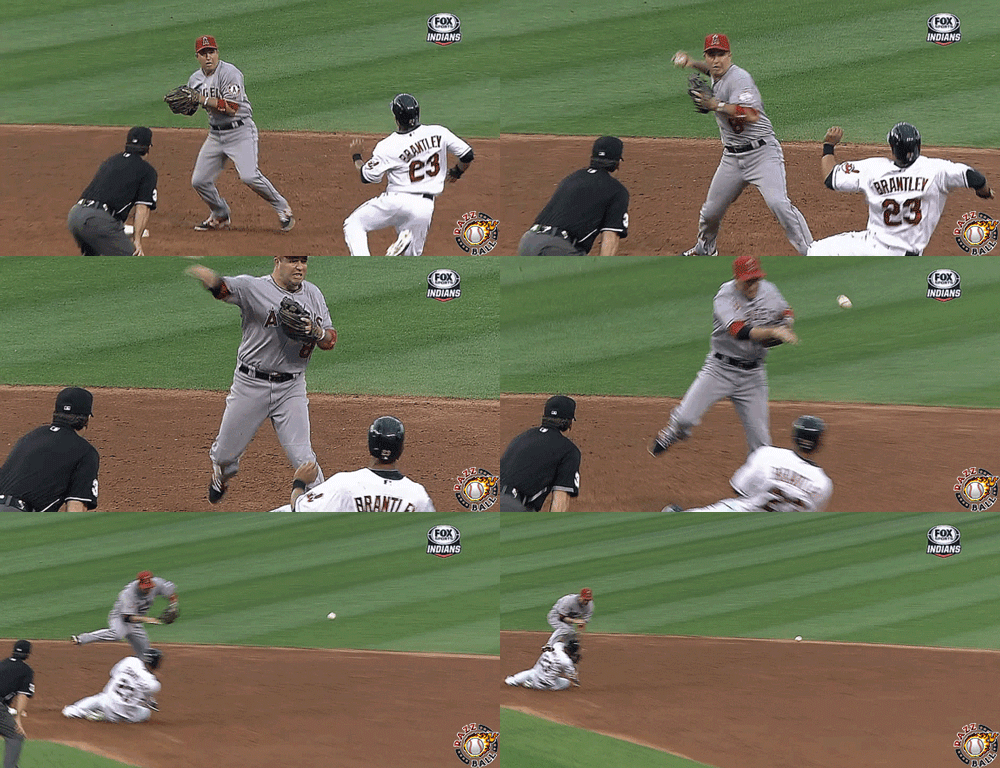
Brantley has had his share of missed games, just like any other player. He recently missed three games after a mishap sliding into second base. Here is a poor attempt of GIF making by me:
Clearly this injury wasn’t his fault, as getting kneed in the head is an extenuating circumstance. He is back in action now, and he seems to be picking up where he left off (3/9 with an RBI). So I’m not too worried about him on that front. 2011 was Brantley’s first year in the majors, and the only year Brantley has hit the DL. He was able to play 114 games that year. Combined between 2012 and 2013 he played in 300 out of a possible 324 games, or 92.59%.
Anticipate 145+ games from Brantley.
Score: 4 out of 5
Category Two: Everything Else
Since Brantley is one of the biggest breakouts this year, I want to see what’s different when compared to the last few years. First I’ll start with hit location.
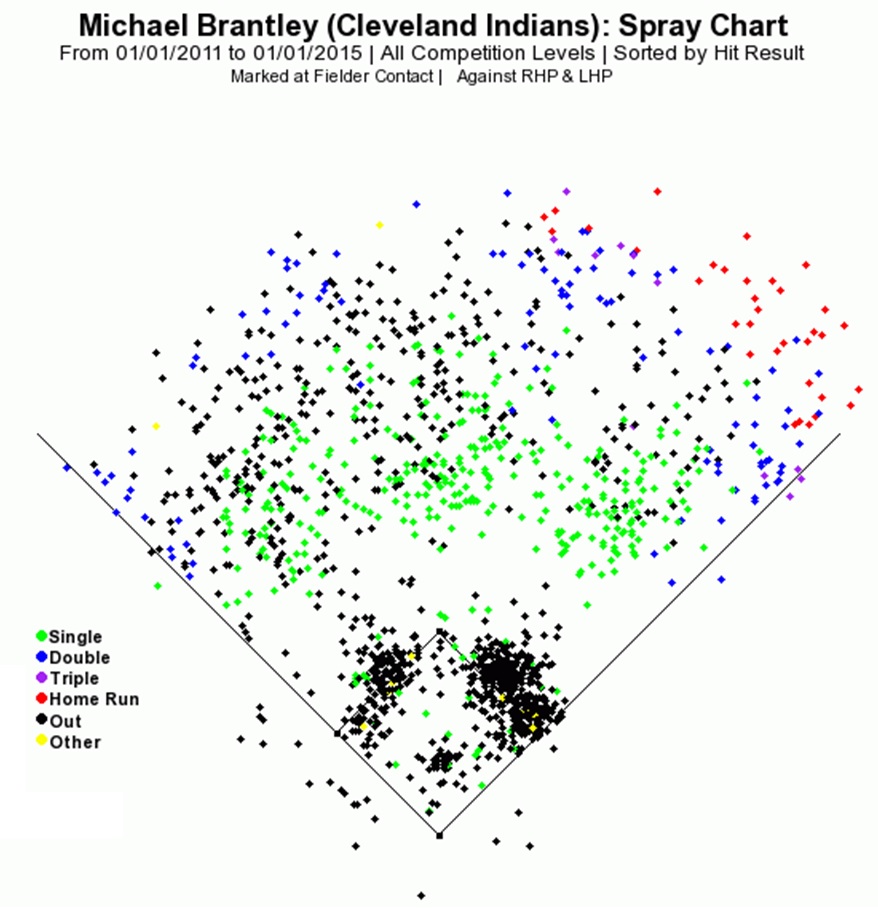
Brantley is great at using the whole field to his advantage. Below is his spray chart from 2011 until present:
If you want to see what that spray chart looks like in number form, I’ve got that too:
| 2011 | 2012 | 2013 | 2014 | Total | |
|---|---|---|---|---|---|
| Pull | 47.50% | 36.48% | 33.54% | 43.62% | 39.36% |
| Center | 34.17% | 40.88% | 43.04% | 34.04% | 38.79% |
| Opposite | 18.33% | 22.64% | 23.42% | 22.34% | 21.85% |
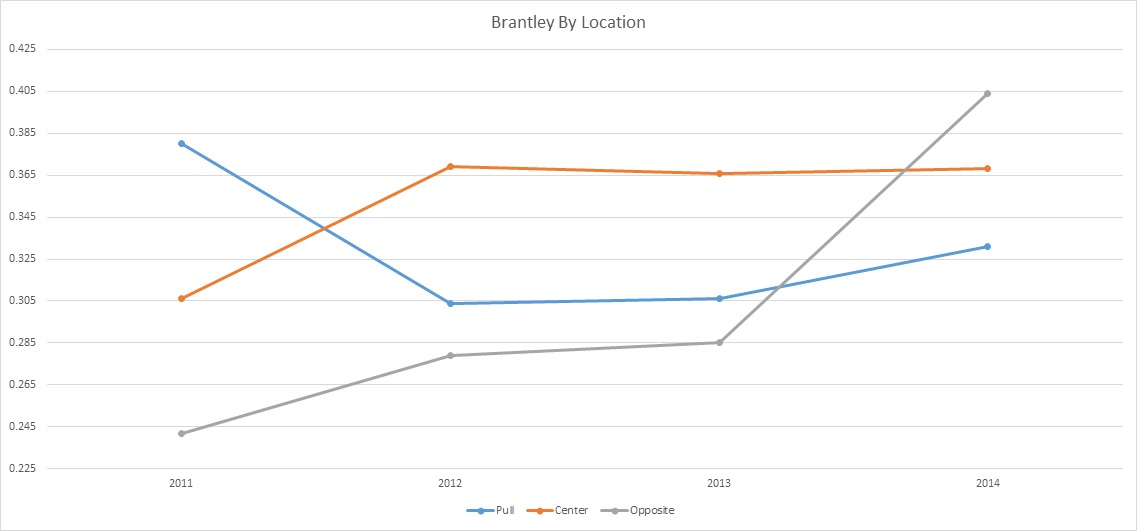
Just over one in five of Brantley’s hits go the opposite way. Notorious pull hitters have about one in ten hits go the opposite way (Mark Teixeira or Gary Sheffield). And he is consistent when it comes to that twenty percent mark, never straying more than four percentage points away from it. The reason I bring this up is because of this next graph:
All of a sudden he is getting hits in the opposite direction, and a lot of them. I don’t know why he is doing this, but I’m going to throw out a guess, so bear (or bull) with me.
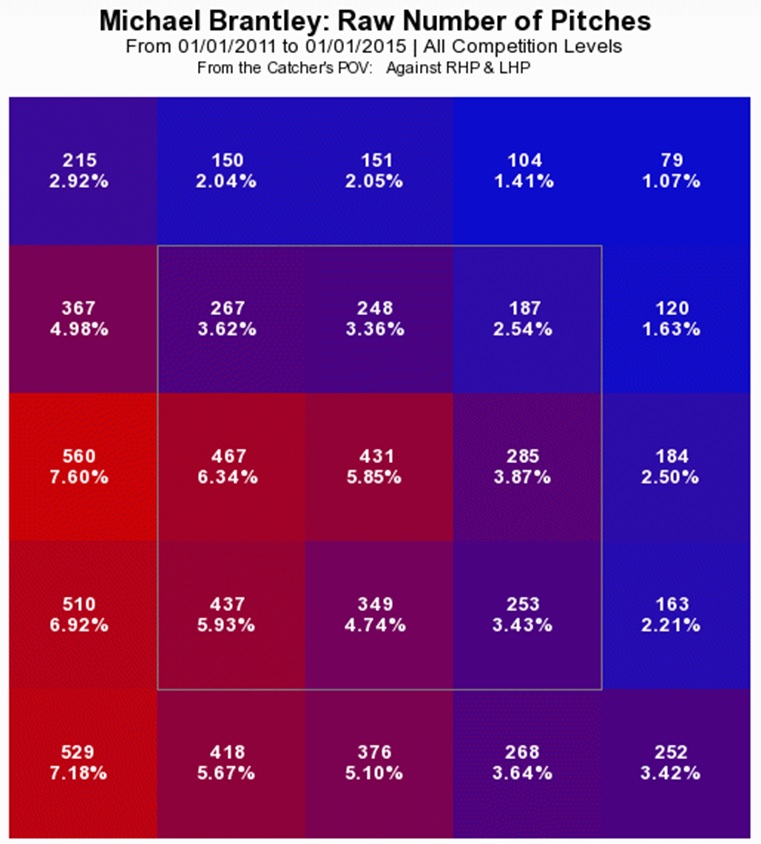
In general, pitchers tend to pitch Brantley low and outside:
I do not have this data, but I would suspect that pitches that are low and outside are harder to pull because you have to reach for them and it is harder to get around on a pitch like that. Given this information, I am going to assume a larger portion of balls hit in this section will be sent towards left field. I am going to look at the nine boxes in the bottom right corner for this, spanning from the center of the zone (431, 5.85%) to the bottom left corner (529, 7.18%). This is Brantley’s average per year in that square:
| 2011 | 2012 | 2013 | 2014 | |
|---|---|---|---|---|
| Average | 0.275 | 0.285 | 0.298 | 0.330 |
That looks pretty significant to me. Especially since pitchers love throwing to him there. I’d say this section of the strike zone has to do a lot with Brantley’s improvements this year. Part of that might go hand in hand with this next chart:
| 2011 | 2012 | 2013 | 2014 | Total | |
|---|---|---|---|---|---|
| Z-Swing% | 50.30% | 57.10% | 59.60% | 60.70% | 54.70% |
| Z-Contact% | 94.70% | 96.50% | 95.50% | 95.40% | 95.70% |
Z-Swing% is how often a batter swings at pitches inside the strike zone. Brantley has gotten much better at doing that, 20.68% better to be exact. When you couple this with the fact that he is making roughly the same amount of contact as always, the end result is more balls being hit. Now some of those are bound to go out of play, but many of them will stay in play. This, in turn, can explain some of the reason that his BABIP is up to 0.324 this year, from 0.304 last year. Quick players are able to sustain higher BABIPs, so I wouldn’t expect regression on that end. Since I haven’t done further research on MB’s speed, I’m basing his speed solely on him averaging fourteen stolen bases a season between 2011 and 2013.
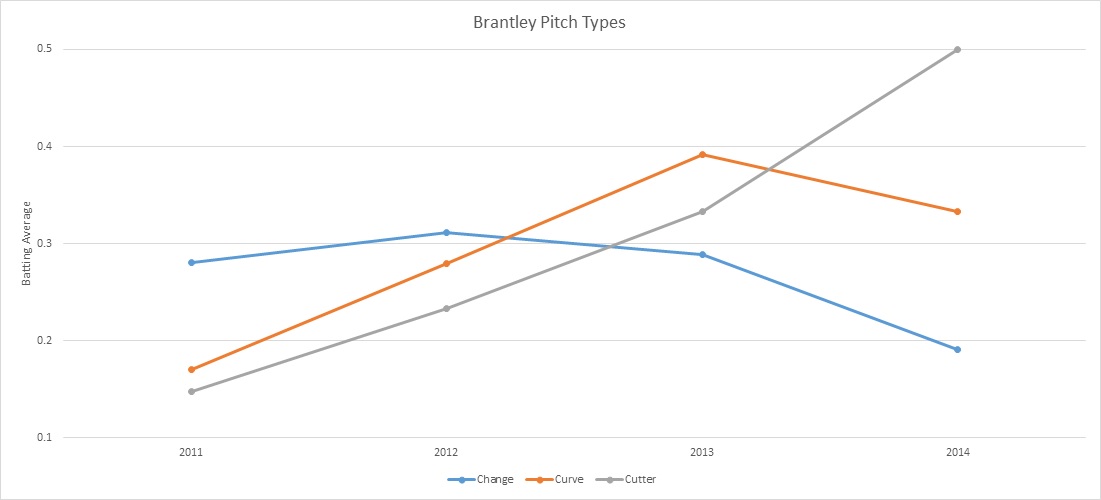
There is one last thing I wanted to look at: Is Brantley struggling or exceling with certain pitches? I charted Brantley’s average against different pitch types. Below is said chart:
I removed the pitch types that didn’t have drastic changes in average, or didn’t have a large enough sample size. As you can see, hopefully, Brantley has gotten very good at hitting cutters and curves. While he has lost some steam with the curve from last year, where he batted 0.392 against it, he has been consistently gaining ground against the cutter. He is hitting an unreal 0.500 against it this year. I do expect that number to fall, but by how much is uncertain. He clearly has the cutter’s number. It’s up to Brantley if he decides to call it back the next day. On the other hand, he seems to have forgotten how to hit a changeup. It doesn’t seem to be affecting him too much, since he is still sitting pretty with an average well over 0.300 and ninety four hits over seventy six games.
Score: 10 out of 15
Overall Score: 14 out of 20
Weighted Score: 140%
Remember to leave a comment about the player you want analyzed for next time!
Jeremy is a contributor for Razzball Baseball. He had a last name, but he lost it in ‘Nam. You can follow the soldier of misfortune on twitter @Jeremy_Razzball, just don’t trigger his flashbacks.


