
I know it’s been a couple of weeks since I’ve posted. Well I’m going to make it up to you. Anyone who finds my Facebook profile will get a personalized note mailed to them; I’ll even seal the envelope with a kiss! Hint: my first name is Jeremy.
On this week’s edition of bears and bulls: Doug Fister. Fister is probably better known for his PG-13 name than for his pitching. We’ve all seen team names like “Fister? I barely know her!” and “Fister in her Pujols”, but I’m not here to talk about unoriginal puns. But I am here to talk about the Nationals newest addition to their already dominant rotation.
Category One: Injury Risk
I find it a little ironic that I’m writing the injury risk section on Fister, but it’s a part of my model, and you don’t mess with perfection.
Fister has an odd injury history. His first full season in the bigs was 2010. He has been on the DL in 2010, 2012, and 2014. But in 2011 and 2013 he was clean; he wasn’t even listed as day-to-day. While this pattern is probably a fluke, it does show that Fister’s most recent injury isn’t an anomaly. In 2012 he went on the DL twice, once in April and once in June. It’s certainly possible that Fister heads back to the DL again this year. They might also decide to give him some extra rest days here and there too.
Fister’s most recent injury was in his right shoulder. He went on the DL in 2010 due to right shoulder fatigue. So it’s definitely not out of the question that his shoulder will start irritating him. He should still be able to compile 20-22 starts this season, and a couple more if he fends off the injury demons. The Nationals might play it safe with Fister though, as they just traded for him (not that they gave up a ton for him).
Score: 2 out of 5
Category Two: Everything Else
The biggest change for Fister this year is his change in scenery. My biggest change from last year is my new tongue and navel rings…best $500 I ever spent. Obviously playing in the NL is better than playing in the AL, but the NL East has been on a tear this year. The other major change here is the ballparks. Below is a comparison of the ballpark factors from 2013:
| Park Name | Runs | HR | H | 2B | 3B | BB |
|---|---|---|---|---|---|---|
| Comerica Park | 1.139 | 1.013 | 1.045 | 1.103 | 1.684 | 1.056 |
| Nationals Park | 1.013 | 0.804 | 1.089 | 1.051 | 0.577 | 0.966 |
For those of you unfamiliar with park factors, higher numbers are hitter friendly, while lower numbers are pitcher friendly. A score of 1 is neutral. Comerica Park (Tigers home field) had the third highest factor for runs, only behind the Cubs and Rockies. Nationals Park (I’ll let you guess who plays there) had the thirteenth highest factor for runs, and is basically the league average. Nationals Park also had the fifth lowest factor for HR and fourth lowest for triples. Clearly his move to Nationals Park is beneficial in a vacuum.
Since Fister is injury prone, I delved into his velocity over the years. I made a graph of his velocity since his debut in 2009. I hope you like it, otherwise I’ll have to call in some favors from my mob connections.
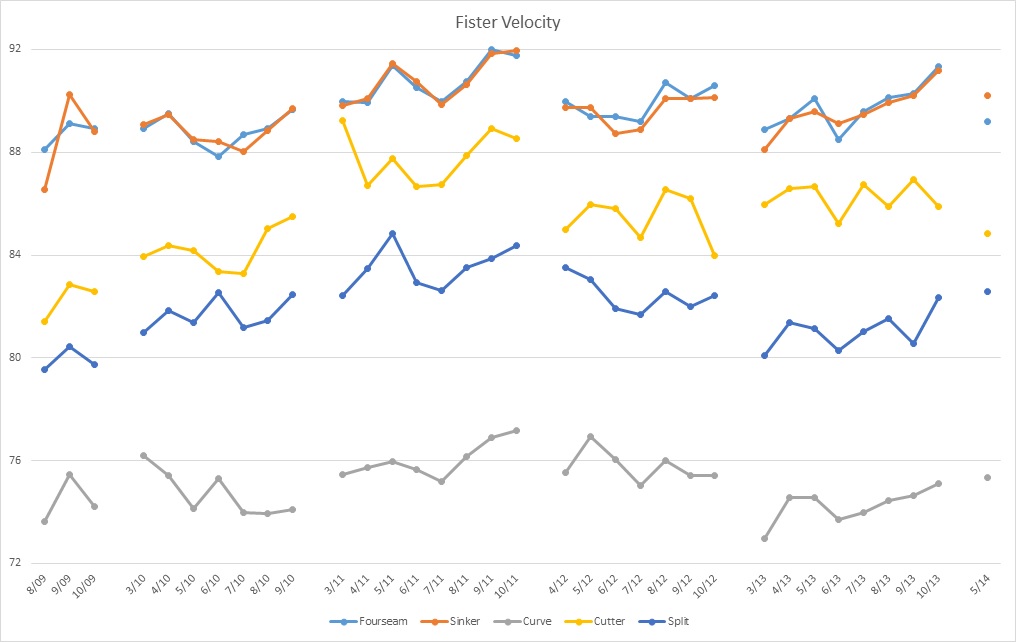
I don’t know why I included this year’s data, it’s not exactly a large sample size. In general, Fister has been trending upwards. It’s also nice that Fister throws five pitches, and his pitches can range about fifteen MPH. He lost some velocity after 2011 that he hasn’t fully regained. Is it a coincidence that he had two DL stints in 2012 and missed a total of fifty-eight days? Probably not. But at least his velocities have been mostly steady since then. As proof, here are his average velocities by month:
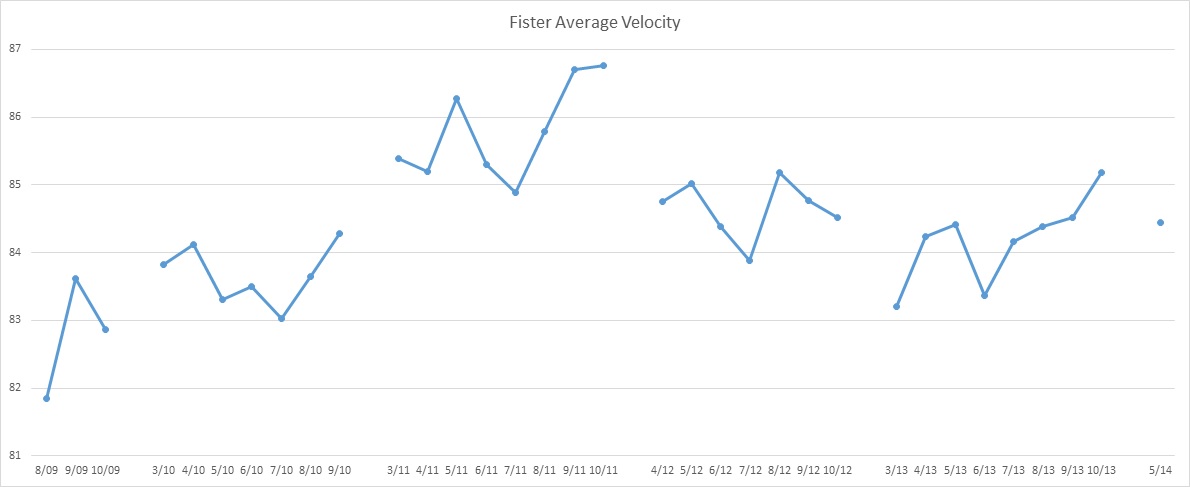
Okay, I have to admit to being lazy here. I didn’t take the weighted averages of his velocities. By that, I mean I didn’t account for the number of each type of pitch he threw in a month. I took the easy way out. Slap some cuffs on me, I deserve it. Despite this, the graph does prove my point about his injuries in 2012. He seems to have stabilized his velocity since then.
Now let’s see how Dougie stacks up against the competition. There have been forty pitchers who had at least 700 IP between 2010 and 2013. Here are Fister’s stats over those four years:
| GS | IP | K/9 | BB/9 | HR/9 | BABIP | ERA | FIP | WAR |
|---|---|---|---|---|---|---|---|---|
| 117 | 753.2 | 6.35 | 1.79 | 0.63 | 0.301 | 3.50 | 3.32 | 15.7 |
Out of those forty, Fister had the eighteenth best ERA and twelfth lest FIP. His WAR over the span puts him in fourteenth. Do you want to know who places directly behind Fister when you sort by ERA? In order: C.C. Sabathia, Zack Greinke, James Shields, and Max Scherzer. That’s a pretty elite squad if you ask me. Three of these guys had an ADP at least fifty spots earlier than Fister (poor Sabathia).
Here are Fister’s stats for just 2013:
| GS | IP | ERA | FIP | xFIP | WHIP | K/9 | BB/9 | K/BB | HR/9 | BAA | BABIP |
|---|---|---|---|---|---|---|---|---|---|---|---|
| 32 | 208.2 | 3.67 | 3.26 | 3.42 | 1.31 | 6.86 | 1.90 | 3.61 | 0.60 | 0.279 | 0.332 |
This looks pretty good, and it leads me to believe he is in line to do even better. This is mostly a BABIP and BAA issue. Fister’s career BABIP is 0.298…he posted a number 0.034 higher than that last year. This caused his BAA to be almost 0.020 points higher than his career number. Despite all this, Fister posted a solid 3.67 ERA and 3.26 FIP. If Fister regresses towards his mean, his ERA could potentially break 3.50, maybe even 3.40 if we’re lucky.
Long story short: I’m not too worried about Mister Fister.
Score: 11.5 out of 15
Overall Score: 13.5 out of 20
Weighted Score: 135%
Fist’er all the way to the bank.
Jeremy is a contributor for Razzball Baseball. He had a last name, but he lost it in ‘Nam. You can follow the soldier of misfortune on twitter @Jeremy_Razzball, just don’t trigger his flashbacks.